


The status of the human immune system is heavily involved in both disease defense and healthy aging or its converse. At enligtenbio we have an interest in understanding human immune function and how immune changes link to lifespan and healthspan. To that end, we would like to highlight key findings from a recently published lifespan analysis of immune system states (Nehar-Belaid et al., 2026). It is well established that age-related decline in immune function (immunosenescence) is linked to various diseases. In particular, inflammation levels over time appear critically tied to aging. Consequently, immune cell functions are frequently analyzed in supercentenarians to understand how this group reaches advanced age while maintaining overall health (Hashimoto et al., 2019). Other studies aim to describe the immune system comprehensively from birth to advanced age (Wang et al., 2025) to understand how the immune system evolves through time, and to compare these changes in relation to both disease and healthy aging. For these analyses, human peripheral blood mononuclear cells (PBMCs) remain a standard model for immune system analysis (Nehar-Belaid et al., 2026)
How Lymphoid Cells Change Across the Lifespan
In the study, Nehar-Belaid and team (2026) profiled PBMCs from 167 healthy individuals aged 2 months to 105 years using single-cell RNA (scRNA-seq) and single-nucleus ATAC-sequencing (snATAC-seq) – see also Figure 1 for study design details.
We will outline some of the key findings, categorized by lymphoid or myeloid cells for convenience.
- Overall dynamics: The infant and elderly immune systems are the most unique among all age groups.
- CD8+vs. CD4+T Cells: There are more pronounced naive-to-memory transitions in CD8+ T cells than in CD4+ T cells and B cells.
- Naive T Cells: Naive CD4+ T cells decrease after infancy, whereas naive CD8+ T cells decline with different kinetics, showing a delayed decline in middle and older ages.
- Memory T Cells: Memory CD4+ T cells accumulate linearly from infancy to middle age. In contrast, CD8+ memory T cells jump sharply after infancy, remain relatively steady, and then rise sharply again in the oldest age groups.
- Potential Explanations:
- Effects of persistent viral infection
- Age-related changes in thymic generation of CD4+ T cells
- Differences in activation or maintenance programs between CD4+ and CD8+ T cells
- B Cells:
- Naive B cells show a continuous decline throughout life.
- Age-associated B cells (ABCs) show a relatively rapid rise in the first two years of life, but no clear pattern thereafter.
- This contrasts sharply with the increase in ABC content seen in the supercentenarian case study (from our previous piece, Inside the Biology of 116 Years of Life: What Multiomics Reveals About Extreme Longevity.)
“CD8+ T Cells Show the Strongest Naive-to-Memory Shift With Ages”
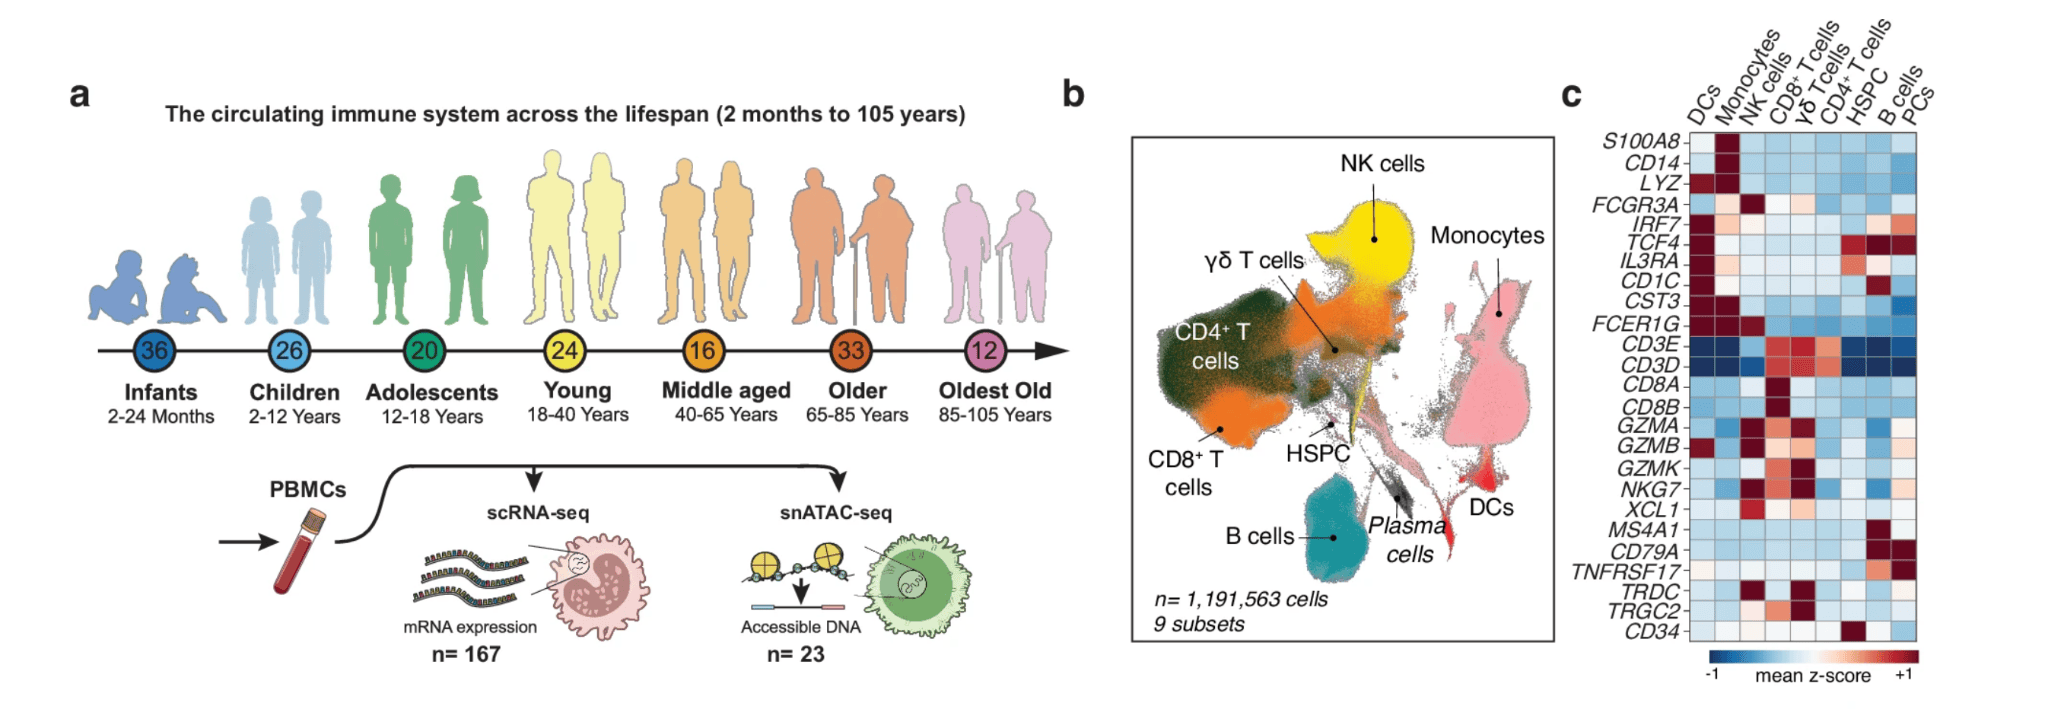
Figure 1: Study design and single-cell profiling of more than 1.1 million PMBC cells, identifying nine major immune cell lineages based on their characteristic gene-expression patterns. Image credit: Nehar-Belaid et al., (2026)
Infants Have a Distinct Interferon-Primed T-Cell Population
Detailed analysis revealed a particular CD4+ T cell subpopulation that constitutively expresses interferon-stimulated genes (ISGhi). These ISGhi cells were found to be more than twice as abundant in infants than in other age groups. While typically associated with acute infection or recent vaccination, in this infant study group, these cells may represent a pre-activated antiviral program that potentially compensates for an otherwise immune immaturity.
SOX4+ Naive CD4+ T Cells Are a Distinct Feature of Infant Immunity
As SOX4 expression has been linked to recent thymic emigrant (RTE) status, its expression in both naive CD4+ and CD8+ T cells was examined. The findings indicate that SOX4+ naive CD4+ and CD8+ T cells comprised 17% and 14% of naive T cells, respectively, and both declined significantly after infancy (see Figure 2). Even within the first two years of life, there is a significant decline in SOX4+ naive T cells for both groups. Furthermore, an examination of chromatin accessibility of transcription factor binding sites in SOX4+ naive CD4+ and CD8+ T cells revealed that sites related to stemness, TGF-β signaling and Th2 commitment were more accessible. This binding site accessibility also declined with age in these naive T cells. Taken together this seems to establish SOX4+ status as a key indicator of infant immunity.
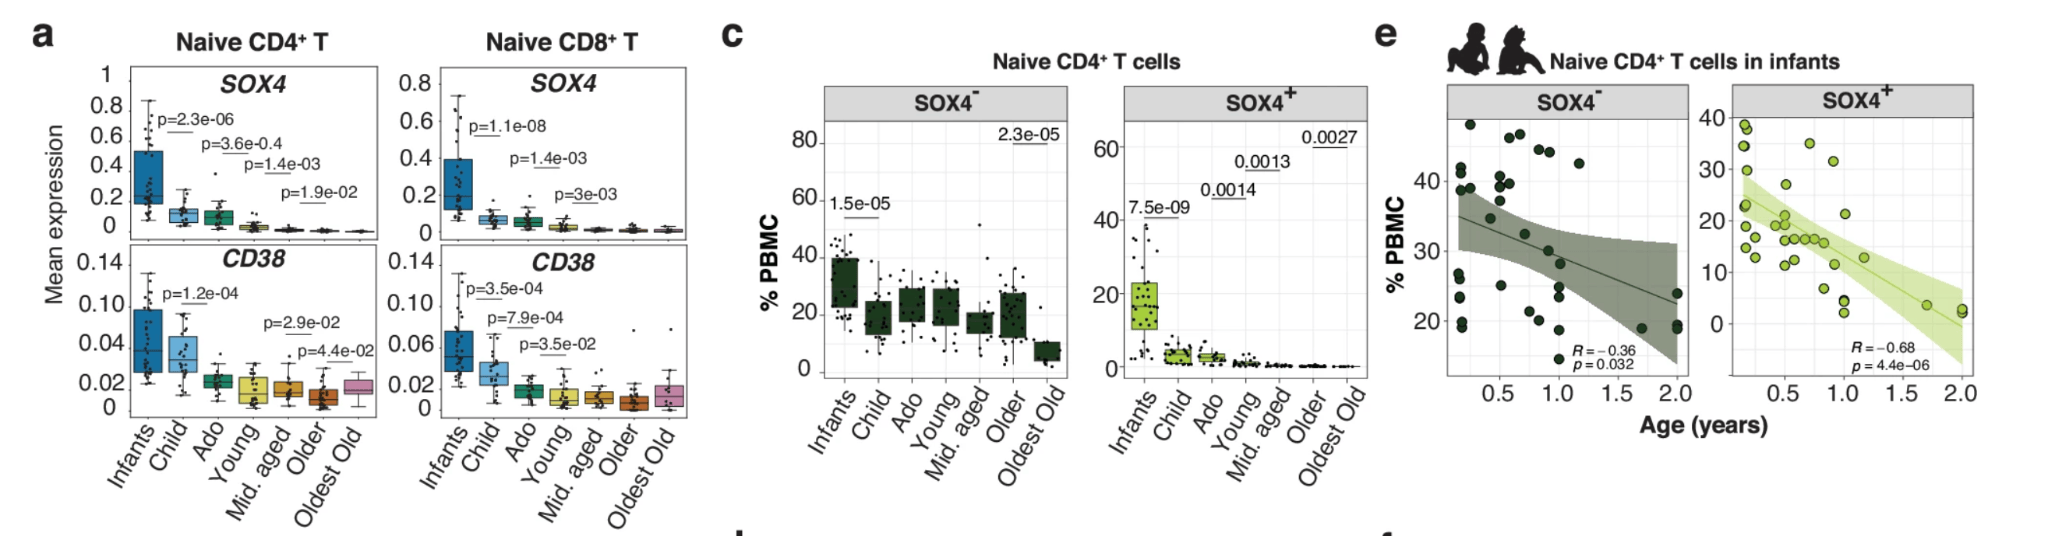
Figure 2: The figures show age-related changes in SOX4 and CD38 expression in naïve T cells, shifts in SOX4+ naïve CD4+ T-cell abundance, and a strong relationship between these cell populations and age during infancy. Image credit: Nehar-Belaid et al., (2026)
MAIT and γδ T Cells Follow a Distinct Rise-and-Fall Pattern with Age
Here is a detailed summary of the recent analysis on CD8+ T cells, γδ T cells, and MAIT (Mucosal-associated invariant T) cells, which were analyzed together due to their transcriptional similarities:
- Naive CD8+ T Cells: Showed a sharp decline with age, dropping from 64% in infants to 11% in older adults, and down to 4% in the oldest age group.
- MAIT Cells: Followed a “rise and fall” pattern. They were lowest in infants and the elderly, peaked during adolescence, and remained relatively high through young and middle adulthood.
- γδ T Cells: Overall, showed a similar pattern of starting lower in infants and rising into adulthood, with a less pronounced decline in the oldest age groups. Further analysis into five clusters revealed:
- γδ2 Lineage (~75% of γδ T cells): Both subclasses (γδ2 GZMB+ and GZMK+) followed the “rise and fall” trajectory.
- γδ1 Lineage (Minority): Two subgroups (γδ1 naive and γδ1 SOX4+) were highest in children and infants, respectively, and declined with age following adolescence.
See also Figure 3 for CD8+ MAIT and γδ T cell changes across lifespan.
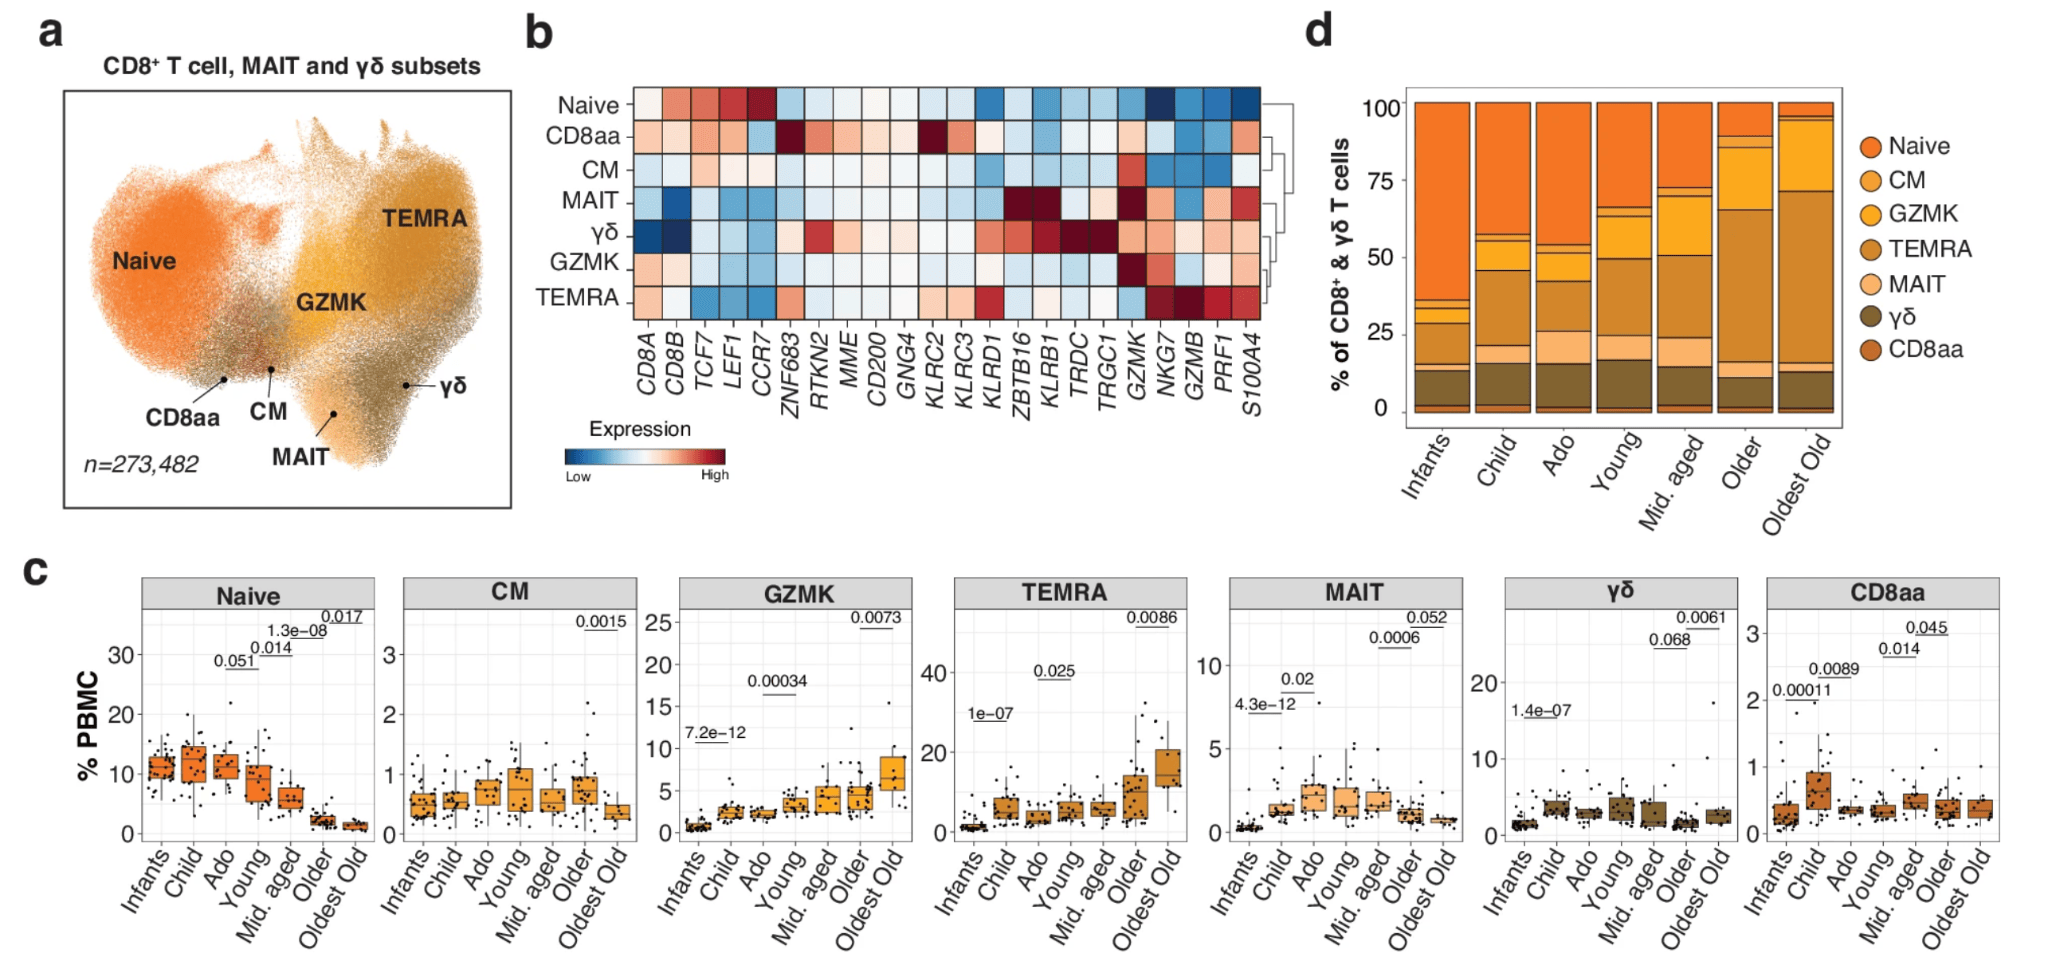
Figure 3: Depiction of changes in CD8+ MAIT and γδ T cells across lifespan. The figure shows how CD8+ T-cell populations and related T-cell subsets differ in their molecular profiles and relative abundance across age groups, highlighting age-associated shifts in immune cell composition.Image credit: Nehar-Belaid et al., (2026)
Potential drivers for these shifts include age-dependent exposures to microbial metabolites (particularly for MAIT cells) and hormonal changes occurring during adolescence and post-menopause/andropause.
How Myeloid Cells Change Across the Lifespan
Monocytes and Dendritic cells (DCs) Increase with Aging
When the myeloid fraction of PBMCs was analyzed, there was a large expansion of all categories of DCs as well as monocytes from infancy to childhood, indicating that most DC remodeling takes place early in life. Both CD14+ and CD16+ monocytes frequencies increased with age with C14+ expansion being greater and earlier from young adult stage onwards. In addition, mature CD16+ NK cells increased progressively with age, from 5% in infants to 15% in the oldest group.
Infant Dendritic Cells Are Dominated by Plasmacytoid DCs
Infants have the lowest dendritic cell (DC) content among age groups, with a distinct composition dominated by plasmacytoid DCs (pDCs), which make up approximately 53% of the total. Because pDCs are strong producers of type I interferon, their relative abundance in infants may reflect an enhanced innate immune response that compensates for relatively underdeveloped adaptive immunity at this early stage.
“Infancy emerges as a uniquely distinct immune state, rather than simply an immature version of the adult immune system.”
What the Immune Lifespan Map Reveals and What Comes Next
The study by Nehar-Belaid et al. (2026) provides a comprehensive analysis of humoral immune changes during the lifespan. Key findings include:
- Aging across all major immune cell lineages was linked to genes involved in inflammatory, apoptotic and stress pathways.
- Younger cohorts showed stronger expression of interferon signaling genes, which may account for the more potent responses to vaccinations or infections observed in young adults.
While this framework will be valuable in clinical analysis of both disease states and aging, the study was limited to PBMCs and did not account for tissue-resident immune cells. Incorporating tissue-resident data in future research could significantly advance our understanding of the immune system.
“The immune system does not simply decline with age—it follows distinct trajectories from infancy through extreme old age.”
References
Nehar-Belaid et al., Single-cell map of the healthy human immune system across the lifespan reveals unique infant immune signatures. (2026) Nature Commun, Jun 15;17(1):7545. Doi: 10.1038/s41467-026-73729-2.
Hashimoto et al., Single-cell transcriptomics reveals expansion of cytotoxic CD4 T cells in supercentenarians. (2019) Proc Natl Acad Sci U S A , Nov 26;116(48):24242-24251. doi: 10.1073/pnas.1907883116.
Wang et al., Integrating single-cell RNA and T cell/B cell receptor sequencing with mass cytometry reveals dynamic trajectories of human peripheral immune cells from birth to old age. (2025) Nat Immunol, Feb;26(2):308-322. doi: 10.1038/s41590-024-02059-6.